What are the key cargo theft statistics?
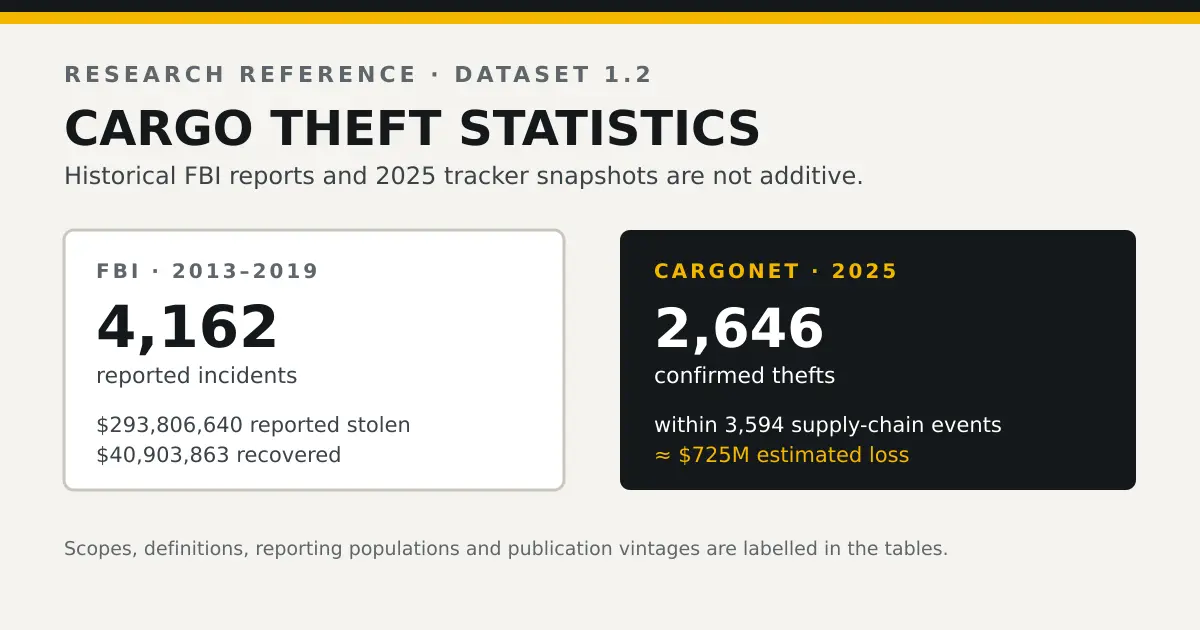
1. Across the FBI’s seven historical cargo theft reports for 2013–2019, reporting agencies recorded 4,162 incidents, $293,806,640 in property stolen and $40,903,863 recovered: 13.9 percent of reported stolen value. These cargo theft statistics describe the compiled reports, not every theft nationwide. (Lakeland Dock Door Repair Research calculations from the seven FBI reports; verified 15 September 2026.) 4, 6, 7, 8, 9, 10, 11
2. Nearly $725 million is CargoNet’s estimated 2025 cargo-theft loss value across the United States and Canada, not a U.S.-only measured total. Its original annual graphic gives $724,978,757. (Verisk CargoNet, annual analysis and graphic, 21 January 2026; verified 15 September 2026.) 2, 30
3. CargoNet recorded 2,646 confirmed cargo thefts within 3,594 supply-chain crime events in 2025, covering the United States and Canada; Overhaul separately recorded 2,576 U.S. cargo theft events for 2025. The counts must not be added. (Verisk CargoNet and Overhaul annual summaries; verified 15 September 2026.) 2, 21
4. The latest cargo-theft report linked in the FBI’s inspected historical UCR archive covers 2019 and records 721 incidents. This archive finding does not establish that later FBI data or products are unavailable. (FBI UCR Publications and Cargo Theft, 2019; archive checked 15 September 2026.) 3, 4
5. CargoNet’s 2025 confirmed-theft count multiplied by its rounded average gives 2,646 × $273,990 = $724,977,540, $1,217 below its published U.S.-and-Canada estimate. The near-match is an arithmetic check, not verification of CargoNet’s estimation method. (Verisk CargoNet inputs; Lakeland Dock Door Repair Research calculation, 15 September 2026.) 2, 30
6. ATRI’s 8 October 2025 research announcement estimates annualized cargo-theft costs to the trucking industry as high as $6.6 billion. It is an industry-cost estimate, not CargoNet’s recorded-event loss series. (American Transportation Research Institute, research announcement; verified 15 September 2026.) 12
7. The $15–35 billion annual cargo-theft estimate on NICB’s reference page is attributed to the U.S. Department of Homeland Security; Glawe’s 15 July 2025 Senate testimony cites ICE’s Operation Boiling Point in footnote 6. The attribution chain is identifiable; its originating calculation was not verified here. (NICB reference page and original Senate testimony; verified 15 September 2026.) 13, 14
8. CargoNet published 3,625 U.S.-and-Canada supply-chain crime events for 2024 in January 2025, then used 3,607 for 2024 in its January 2026 comparison: 18 fewer in the later publication. Preserve the publication vintage. (Verisk CargoNet annual releases, 21 January 2025 and 21 January 2026; verified 15 September 2026.) 2, 15
9. For Q2 2026, Overhaul reported 605 U.S. incidents, up 5 percent from Q1, while CargoNet reported 677 U.S.-and-Canada incidents, down 14 percent using its own Q1 comparison snapshot. These are separate provider-reported changes. (Overhaul Q2 overview and Verisk CargoNet, 6 August 2026; verified 15 September 2026.) 16, 17
10. In the FBI’s 2019 cargo-theft property table, the “Recordings” category totals $120,033,130, 85.9 percent of reported national stolen value, with $0 recovered; the category was $500 in 2018. This is a category aggregate, not an identified single incident. (FBI Cargo Theft, 2019 and 2018, Table 2; share calculated and verified 15 September 2026.) 4, 10
11. Excluding the FBI’s 2019 “Recordings” category changes the calculated recovered-value share from 2.8 percent to 19.6 percent for that year. This is an exclusion sensitivity test, not a corrected FBI total or evidence that the published category is erroneous. (Lakeland Dock Door Repair Research calculation from FBI Tables 1 and 2, 15 September 2026.) 4
12. Florida accounts for 54.7 percent of reported stolen value in the compiled FBI cargo theft reports for 2013–2019. Florida, Michigan and Tennessee are the three states with incident rows in all seven reports; reporting coverage differs between states. (Lakeland Dock Door Repair Research compilation, verified 15 September 2026.) 4, 6, 7, 8, 9, 10, 11
13. Across the FBI’s 2014–2019 cargo-theft location tables, harmonized parking-lot/drop-lot/garage entries total 1,558 of 4,168, or 37.4 percent; dock/wharf/freight/modal-terminal entries total 316, or 7.6 percent. These are location entries, not unique incidents. (Lakeland Dock Door Repair Research compilation of six FBI Table 3 reports, verified 15 September 2026.) 4, 7, 8, 9, 10, 11
14. Under Florida Statutes § 812.014, 2026 edition, the specific cargo-in-commerce provisions classify theft of qualifying cargo below $50,000 as second-degree grand theft, with no stated minimum in that clause, and $50,000 or more as first-degree grand theft. Other statutory conditions and enhancements still matter. (Florida Senate, § 812.014(2)(b)2. and (2)(a)2.; verified 15 September 2026.) 18
15. For 2019, the FBI reported 41 participating states but 27 states with valid cargo theft incidents published, illustrating the difference between participation and published incident coverage. (FBI, Cargo Theft, 2019; verified 15 September 2026.) 4
By Lakeland Dock Door Repair Research · Last verified: 15 September 2026.
The key cargo theft statistics above combine a historical FBI compilation with separately labelled current provider figures. Every line retains its period and measurement scope; none is a census of all thefts, and counts from different collections are not additive.
On this page
- What does the federal cargo-theft record actually contain?
- How many cargo thefts happen in the United States each year?
- What does the federal record actually show, and what doesn't it?
- How was this cargo-theft dataset compiled?
- Who counts cargo theft, and what does each tracker measure?
- How much does cargo theft cost, and where does "$35 billion" come from?
- Which states report the most cargo theft?
- What kinds of cargo get stolen?
- What happened to the FBI's 2019 numbers?
- Where is cargo theft reported to happen?
- What legally counts as cargo theft?
- What do Florida and Polk County’s cargo-theft records show?
- Is cargo theft rising or falling?
- Why does the measurement gap matter for public policy?
- What can these figures not establish?
- Which figures or underlying details were not verified?
- What is the attribution reference for this page?
- What is included in the downloadable dataset?
- What are the answers to common cargo-theft statistics questions?
- Which primary sources support this page?
What does the federal cargo-theft record actually contain?
The FBI’s seven historical cargo theft reports for 2013–2019 contain 4,162 reported incidents and $293.8 million in reported stolen property, when their annual totals are summed. Those reports provide a federal evidence series, but the historical archive’s endpoint is not proof that the FBI stopped collecting or publishing cargo-related data elsewhere. 3, 4, 6, 7, 8, 9, 10, 11
Here is the chain, and it is short enough to check yourself.
2006. Congress passed the USA PATRIOT Improvement and Reauthorization Act of 2005, enacted on 9 March 2006. Section 307(e) required the Attorney General to ensure that cargo-theft reports collected by federal, state and local officials appeared as a separate category in the Uniform Crime Reporting System, or its successor, by 31 December 2006. The law establishes the reporting requirement; it does not establish the completeness of any later annual table. 32
2010–2013 data. The FBI’s 2019 report describes finalization of the data specifications in 2010. The earliest data year in this compilation is 2013, published in the Cargo Theft Update document dated April 2015. A data year is not necessarily a report’s publication year. 4, 6
2013–2019. Seven annual data years, each in a separate FBI report. This compilation joins their national totals and state rows, selected property values and six complete location tables. The cross-year totals and calculations are original work by this publication; no claim is made that nobody has assembled these reports before.
The archive checked on 15 September 2026. The FBI’s UCR Publications page places these reports in its historical-publications collection through 2019. It lists the cargo theft reports for 2013 through 2019. That is the archive examined here, not an inventory of every FBI data product. 3
Later data. The FBI directs users to the Crime Data Explorer for newer crime-data access. No post-2019 cargo-theft extract from that system was independently obtained and reproduced for this edition, so this page does not publish a newer federal incident count or compare an unverified extract with commercial-provider totals. 3, 5
30 April 2026. The FBI’s Internet Crime Complaint Center published “Cyber-Enabled Strategic Cargo Theft Surging.” Its 2025 U.S.-and-Canada figures—nearly $725 million in estimated losses, a 60 percent loss increase, an 18 percent increase in confirmed incidents, and a $273,990 average reported as 36 percent higher—match the figures in CargoNet’s 21 January 2026 release. The advisory does not name CargoNet. 1, 2
That is a numerical match between two documents. It does not establish how the FBI obtained the figures, whether another source supplied them, or why those figures were selected. The advisory is not presented here as an independently collected FBI UCR annual total.
The measurement distinction matters more than the matching wording: an FBI advisory, an FBI statistical table and a CargoNet estimate are different kinds of evidence, even when a number appears on more than one website.
Table 1 — Federal and private cargo theft counts verified for this compilation
| Source | Data year or product | Count | What the count is | Territory |
|---|---|---|---|---|
| FBI UCR historical Cargo Theft report | 2019 | 721 | Cargo theft incidents in the inspected annual report | U.S. reporting agencies |
| FBI Crime Data Explorer | Later data-access system | Not entered | No post-2019 cargo-theft extract independently reproduced in this edition | Depends on selected extract |
| Verisk CargoNet | 2025 | 2,646 | Confirmed cargo thefts within 3,594 supply-chain crime events | United States and Canada |
| Overhaul | 2025 | 2,576 | Cargo theft events stated in the publisher’s annual overview | United States |
Source: FBI Cargo Theft, 2019; FBI UCR Publications and Crime Data Explorer; Verisk CargoNet annual analysis, 21 January 2026; Overhaul’s own 2025 annual overview. Verified 15 September 2026. Counts are not directly comparable. 2, 3, 4, 5, 21
The missing contemporary federal value in Table 1 is deliberate. A secondary analysis can point to a dataset worth obtaining, but it cannot replace an independently checked extract in a primary-source compilation.
Differences in reporting coverage can affect recorded counts. This compilation does not quantify how much of any cross-year change reflects coverage, classification, reporting behaviour or changes in theft itself. Assigning that change to one cause without the necessary evidence would be another unsupported statistic.
The historical series remains useful on its own terms: it records submitted incidents, reported stolen and recovered value, and the composition of the participating agencies’ data. The following sections preserve those terms rather than turning them into a complete nationwide crime census.
How many cargo thefts happen in the United States each year?
The inspected FBI historical report counted 721 incidents in 2019; CargoNet counted 2,646 confirmed cargo thefts across the United States and Canada in 2025, inside 3,594 supply-chain crime events. Overhaul’s own annual overview counted 2,576 U.S. cargo theft events in 2025. These are source-specific reported counts, not interchangeable answers to the total number of thefts nationwide. 2, 4, 21
We checked the seven FBI reports and put their annual totals in one table. The result is a seven-year historical compilation, not a claim to have exhausted all federal data products or to be the first person to total the reports.
Table 2 — FBI Uniform Crime Reporting, cargo theft, national totals 2013–2019
| Year | Agencies reporting an incident | Incidents reported | Value stolen | Value recovered | Recovered-value share, calculated | Participating states, source label | Valid-incident jurisdictions, source count |
|---|---|---|---|---|---|---|---|
| 2013 | 83 | 189 | $11,967,310 | $2,135,610 | 17.8% | 7 | 7 |
| 2014 | 134 | 547 | $32,591,534 | $7,707,357 | 23.6% | 29 | 17 |
| 2015 | 121 | 628 | $27,872,130 | $5,492,273 | 19.7% | 31 | 19 |
| 2016 | 147 | 692 | $26,933,356 | $8,449,949 | 31.4% | 30 | 20 |
| 2017 | 145 | 736 | $21,721,702 | $5,731,104 | 26.4% | 33 | 18 |
| 2018 | 181 | 649 | $33,043,046 | $7,538,754 | 22.8% | 35 | 22 |
| 2019 | 184 | 721 | $139,677,562 | $3,848,816 | 2.8% | 41 | 27 |
| 2013–2019 | — | 4,162 | $293,806,640 | $40,903,863 | 13.9% | — | — |
Source: FBI Cargo Theft reports for 2013–2019, national totals and participation statements checked 15 September 2026. Totals and recovered-value shares calculated by Lakeland Dock Door Repair Research; the share is recovered dollars divided by stolen dollars, not the percentage of cases solved. 4, 6, 7, 8, 9, 10, 11
The 2015 jurisdiction label needs care. The report’s chart uses a count of 19 states with valid incidents, but its Table 1 contains 18 states plus Guam. The numerical count of 19 is retained above; the underlying dataset identifies Guam as a territory rather than silently counting it as a state.
Data and attribution: National CSV · State-year CSV · Calculation register. Compilation: Lakeland Dock Door Repair Research; underlying data: FBI UCR; version 1.2-2026-09-15. The attribution reference supplies the page title and canonical address.
Three things in that table deserve a writer's attention before it is quoted.
The 2019 stolen-value total is heavily concentrated in one property category. The “Recordings” category accounts for 85.9 percent of that year’s reported stolen value. The report does not establish that this category is a mistake, one incident, or an unreal loss; see the 2019 concentration and sensitivity analysis.
Participation is not coverage. In 2019, 41 states took part and 27 produced an incident the FBI could validate and publish. In 2017, 33 took part and 18 did. A state absent from a given year's table is not a state without cargo theft; it is a state without a publishable submission.
The validation issue is also examined in the literature. The publisher’s abstract for a 2025 Journal of Applied Security Research article describes an examination of reports submitted to the FBI during 2013–2021 and says only a small fraction met the required criteria. This page relies on the abstract for that description; it does not claim to have reviewed the study’s full text or reproduced its analysis. 19
What does the federal record actually show, and what doesn't it?
The seven-year federal series shows the incidents and property values accepted into the inspected FBI reports. It does not establish all cargo theft nationwide, a constant-coverage crime trend or the probability that a particular shipment will be stolen. 4, 6, 7, 8, 9, 10, 11
What it shows: the composition of reported cargo theft—which jurisdictions submitted incident rows, which locations and offence types were recorded, and the reported stolen and recovered dollar values. Those quantities describe the included reports; they do not automatically describe every carrier, facility or region.
What it does not show: a complete nationwide total, an exposure-adjusted trend or shipment risk. A count can increase because more incidents are reported, because reporting coverage changes, because classifications change, or because theft increases. These aggregate tables do not separate those possibilities.
A denominator is missing from this compilation, not from the world. Official freight datasets exist, including the Census Bureau’s Commodity Flow Survey. But this page has not matched a shipment-exposure population to the reporting agencies, incident definitions, geographies and time periods in the cargo-theft numerators. A broad freight total is not automatically the right denominator for a selective incident database. 35
What nobody should do with these tables: add the FBI’s count to CargoNet’s or Overhaul’s. The same event may appear in more than one collection, the collections use different scopes, and this compilation has no event-level crosswalk for deduplication. A sum would not be a defensible unique-theft total.
The practical distinction is simple. “CargoNet recorded an increase” identifies a source and its measured population. “The risk of any U.S. shipment being stolen increased by that percentage” requires evidence that these tables do not supply.
How was this cargo-theft dataset compiled?
We checked the seven FBI Cargo Theft reports for 2013–2019 and compiled their national totals, all state-and-territory incident rows, selected property values and the six 2014–2019 location tables. A portable Python script generates the dataset and reproduces the page’s derived comparisons; the source totals remain unchanged when checks reveal a discrepancy.
What we collected. The national figures and participation statements come from the FBI’s separate historical reports. All 130 state-or-territory/year rows in their Table 1 records are retained. The six location tables are transcribed by category; the selected property extract includes the 2018 and 2019 “Recordings” figures used in the concentration analysis. It is not a claim to reproduce every property table in full. 4, 6, 7, 8, 9, 10, 11
The second evidence layer. We separately record selected CargoNet and Overhaul publication snapshots, original annual graphics, source-reported loss estimates, the Florida statutory clauses and the primary statements used in the attribution comparison. These are aggregate observations, not access to private incident databases. A publisher’s overview is identified as an overview rather than treated as a full report.
When. The sources supporting published observations were checked on 15 September 2026. Each record carries its source and verification date; where a live page or full document could not be retrieved, that limitation is stated and unsupported numerical claims are not carried into the dataset.
How we processed it. The script calculates totals, shares, recovered-value proportions, state rankings, pooled location composition, source-vintage differences and the explicitly labelled sensitivity checks from stored inputs. Source-reported percentages and calculated percentages occupy separate fields. The script and inputs ship with the downloads, so arithmetic can be repeated without private data or external software services.
Two checks we ran, and what they found.
First, we summed each year’s state-and-territory rows against the published national total. Incident counts reconcile in all seven years. Known stolen values reconcile with the printed national value in six years; for 2014, the sum of the known entries is $1 below the published total. Hawaii’s stolen value in that table is unknown, but the report does not establish that the unknown value explains the $1 difference. Unknown values remain blank in CSV and null in JSON.
Second, in the FBI’s 2013 release the recovered-value state rows sum to $2,138,610, against a printed total of $2,135,610—a $3,000 difference. We publish both numbers and do not assign a cause. The national time series uses the printed national totals; state-level calculations use the state rows. This means pooled state recovery dollars and pooled printed national recovery dollars also differ by $3,000.
A jurisdiction check. The pooled state table contains 36 states and Guam: 37 jurisdictions in all. The 2015 source chart’s count of 19 valid-incident jurisdictions corresponds to 18 states plus Guam in the table. We retain the source’s count and separately label the territory. An absent jurisdiction/year is not filled with zero.
Label harmonisation. Location labels change punctuation, capitalization and wording across the reports. “Parking Lot/Garage” in the earlier tables is grouped with the later parking/drop-lot/garage label. Highway/road/alley/street wording is grouped with the later label that includes sidewalk; commercial/office-building and dock/wharf/freight/modal-terminal variants are also aligned. The location download retains the source-era label and the harmonized label, so the pooling decision is visible. These harmonizations do not turn locations into facilities or unique incidents.
Rounding. Percentages are calculated from unrounded input values and rounded only for display. National recovered-value shares are calculated here; the dataset separately preserves the source’s printed values where available. A percentage-point change subtracts shares; a percentage change divides the difference by its starting value.
What we did not do. We did not estimate values for non-reporting jurisdictions, replace unknown values with zero, reconstruct exact counts from rounded shares, deduplicate providers’ incident databases, or infer the underlying method from a near-match between a count-times-mean calculation and a loss estimate. No exclusion sensitivity is substituted for a published FBI total.
What “verified” means here. ★ Directly checked means the published observation was checked against the originating document, official page, original graphic or the originating organization’s own release. ● Awaiting primary re-verification is reserved for internal research candidates; no such numerical candidate is included as a verified observation. A directly verified attribution is not the same as verification of the underlying estimate’s model, and neither tier guarantees complete crime reporting.
Reproducing and updating the files. The bundled build_dataset.py uses Python’s standard library and writes the named CSVs, JSON and calculation-check files into a chosen directory. Running it reproduces the stored snapshot; it does not silently fetch new figures. When a source changes, its new inputs must be checked, its publication vintage recorded and the calculations rerun before the displayed verification date or dataset version is advanced.
Who counts cargo theft, and what does each tracker measure?
CargoNet, Overhaul, the FBI and ATRI publish different kinds of cargo-theft evidence: provider-recorded events, agency-reported incidents and an industry-cost estimate. Their scope, collection methods and publication vintages differ, so a figure needs its source name and definition to remain meaningful. NICB and HSI-related references add investigative and estimate-attribution evidence; they are not interchangeable incident series. 2, 4, 12, 13, 14, 21
Table 3 — What each cargo theft tracker counts
| Tracker or source | Publisher | What the inspected material measures | Territory | Evidence and method available here | Verified figure or boundary | Publisher context |
|---|---|---|---|---|---|---|
| FBI UCR Cargo Theft reports | FBI | Cargo-theft incidents and property values reported by participating agencies | U.S. reporting jurisdictions; Guam appears in 2015 | Historical national and state tables; reporting and validation notes | 721 incidents and $139,677,562 reported stolen in the 2019 report | Federal statistical publication |
| FBI Crime Data Explorer | FBI | Crime-data access system, distinct from the historical PDF series | Depends on extract and reporting population | No later cargo-theft extract independently reproduced here | No post-2019 cargo count entered | Federal data-access system |
| Verisk CargoNet | Verisk CargoNet | Broad supply-chain crime events and, where separated, confirmed cargo thefts | United States and Canada | Original releases give counts and comparison cutoffs; selected releases explain loss estimation | 3,594 broad events / 2,646 confirmed thefts / estimated nearly $725 million in 2025 | Commercial cargo-theft intelligence provider |
| Overhaul | Overhaul | Cargo-theft events recorded in its own reporting | United States for the headline counts used here | Public annual and quarterly overviews; no private incident file reproduced | 2,576 U.S. events in the 2025 overview | Commercial supply-chain risk provider |
| ATRI | American Transportation Research Institute | Annualized industry cargo-theft costs | U.S. trucking-industry research | Original research announcement; full model not reproduced here | As high as $6.6 billion annually, announced October 2025 | Trucking-industry nonprofit research organization |
| NICB | National Insurance Crime Bureau | Investigative case activity and estimates attributed to other organizations | Depends on the statement | Its own reference page and original Senate testimony | $15–35 billion annual estimate attributed to DHS; not a NICB incident census | Insurance-crime investigation organization |
| HSI / ICE attribution | Homeland Security Investigations / U.S. Immigration and Customs Enforcement | The estimate attributed to a federal program in the inspected NICB sources | U.S. annual losses as described by the citing sources | ICE page not directly retrieved; its originating calculation not verified | Attribution destination identified; no independently reproduced loss model | Federal law-enforcement program |
Source: Original FBI reports and data-access pages; CargoNet and Overhaul releases; ATRI’s 8 October 2025 announcement; NICB’s own reference page and Glawe’s original testimony. Checked 15 September 2026. Publisher context is not a data-quality score. 2, 3, 4, 5, 12, 13, 14, 21
Two trackers, one quarter, opposite directions
The clearest demonstration that these are different instruments is what happened in the second quarter of 2026.
Overhaul recorded 605 US cargo theft incidents in Q2 2026 and described the quarter as a 5 percent increase over Q1 2026. 16 CargoNet documented 677 US-and-Canada incidents in Q2 2026 and described the quarter as a 14 percent decrease from Q1 2026. 17
Same three months. Same continent. Opposite signs.
Table 4 — CargoNet and Overhaul, same quarters, different counts
| Quarter | CargoNet (US + Canada) | Overhaul (US only) | CargoNet higher by |
|---|---|---|---|
| Q2 2025 | 884 | 525 | 68.4% |
| Q1 2026 | 767 | 574 | 33.6% |
| Q2 2026 | 677 | 605 | 11.9% |
Source: CargoNet’s original Q2 2025, Q1 2026 and Q2 2026 releases; Overhaul’s own Q2 2025 and Q2 2026 overviews and its issuer-authored Q1 2026 release. Verified 15 September 2026. Gap = (CargoNet count − Overhaul count) ÷ Overhaul count; it compares these published snapshots, not matched theft populations. 16, 17, 20, 27, 28, 29
Territory is one difference: CargoNet includes Canada, while the Overhaul headline counts used here are U.S.-only. Reporting sources, event definitions and reporting cutoffs can also differ. The inspected summaries do not provide an event-level crosswalk or a matched U.S.-only comparison that would let this compilation allocate the count gap among those causes.
Why published snapshot counts and later comparison percentages can differ
This one trips up careful writers. The source notes document different comparison cutoffs; that identifies a comparability problem without revealing every intervening database change.
CargoNet’s Q2 2026 release describes the quarter as down 14 percent from Q1 2026. Comparing the initially published counts—767 for Q1 and 677 for Q2—produces a decline of 11.7 percent. Those calculations use different Q1 snapshots, so the difference is not resolved by silently changing either published number.
The answer is in the two releases' methodology notes, and it is a matter of reporting cutoffs — the date on which a quarter's data is frozen for analysis.
- The Q1 2026 release states that Q1 2026 data was updated through 14 April 2026. 20
- The Q2 2026 release states that its Q1 2026 comparator uses data through 27 April 2026. 17
The comparator cutoff is 13 days later. A rounded 14 percent decline does not identify an exact revised Q1 count, and the releases do not establish that any difference consists solely of late reports. The initial count remains 767 in the snapshot table; the 14 percent remains CargoNet’s reported change against its later comparator.
The practical rule is firm: a count and a percentage can be quoted together when their scope and comparison baseline match. Do not recalculate a provider’s later percentage from an earlier published count without identifying the vintage mismatch. Different cutoffs alone do not prove an error, and they do not prove that every difference has been explained.
CargoNet revised its own 2024 total
The same effect operates on annual figures, and here it moved the other way.
CargoNet's annual release of 21 January 2025 reported 3,625 incidents for 2024, a 27 percent increase over 2023. 15 Its annual release of 21 January 2026 gives 2024 as 3,607 supply chain crime events. 2 Same publisher, same year, two totals, exactly twelve months apart — revised down by 18 events.
Eighteen events out of 3,625 is approximately half a percent. The point is not the size of the difference: a 2024 value needs its publication context. Use 3,607 with the matched 2024–2025 comparison in the January 2026 release; preserve 3,625 when describing what the January 2025 release reported. The earlier release’s 27 percent change belongs to its own comparison, not automatically to a later database snapshot.
Table 4a — Figures restated by their own publisher
| Figure | First published | As published | Later restated | Restated value |
|---|---|---|---|---|
| CargoNet 2024 supply chain crime events | 21 January 2025 | 3,625 | 21 January 2026 | 3,607 |
| CargoNet Q1 2026 reporting cutoff | 23 April 2026 | Data through 14 April 2026 | 6 August 2026 | Data through 27 April 2026 |
Source: CargoNet annual releases of 21 January 2025 and 21 January 2026, and quarterly releases of 23 April 2026 and 6 August 2026. Checked 15 September 2026. The first row records two published annual values; the second records two stated Q1 comparison cutoffs, not an exact revised Q1 count. These differences do not independently establish their cause. 2, 15, 17, 20
A separate Overhaul comparison remains unresolved
Overhaul’s Q2 2026 overview reports 605 incidents, describes them as 5 percent higher than Q1 2026, and also says 5 percent lower than Q2 2025. Its earlier Q2 2025 overview reports 525 incidents. Comparing those two published counts produces a 15.2 percent increase, not a 5 percent decline. 16, 29
The inspected overview does not supply a reconciled Q2 2025 comparator explaining that difference. We therefore retain 605, 525 and the publisher’s separately labelled −5 percent statement in the vintage register, but do not publish the annual direction as a settled, harmonized trend. The inconsistency is visible rather than converted into a confident correction.
CargoNet has a related snapshot boundary: its original Q2 2025 release reports 884, while its Q2 2026 release describes 677 as 26 percent lower than the later Q2 2025 comparator. The later release identifies a 27 July 2025 comparison cutoff; the original release was published on 17 July 2025. Comparing 884 with 677 gives −23.4 percent for those two snapshots, not the later release’s −26 percent. Neither figure is silently substituted for the other. 17, 28
How much does cargo theft cost, and where does "$35 billion" come from?
CargoNet estimates nearly $725 million in 2025 cargo-theft losses across the United States and Canada; its original graphic states $724,978,757. A count-times-rounded-average calculation comes close but does not verify the estimation method. The larger $15–35 billion annual claim has an identifiable attribution trail in NICB and Senate sources, but this compilation has not verified its originating calculation. 2, 13, 14, 30
Checking the $725 million against the published inputs
CargoNet's 21 January 2026 release publishes three numbers: 2,646 confirmed cargo thefts, an average value per theft of $273,990, and estimated losses of "nearly $725 million." 2
Multiply the first two:
2,646 × $273,990 = $724,977,540
The product is $1,217 below CargoNet’s original graphic, which states $724,978,757. That is close enough to be a useful check, but proximity does not establish which observations had values or how missing values were estimated. 30
The prior-year inputs do not reproduce the earlier graphic to the same degree. CargoNet’s January 2026 comparison gives 2,243 confirmed thefts for 2024 at an average of $202,364:
2,243 × $202,364 = $453,902,452
CargoNet’s original 2024 graphic instead states $454,914,764, a $1,012,312 difference from that product. These are inputs from different publication vintages as well as a rounded mean. The arithmetic cannot establish the cause of the difference, and this page does not replace either published estimate with its own product. 2, 31
Two things follow, and both are things a writer needs.
The event count and the average need their own definitions. CargoNet distinguishes 3,594 broad supply-chain crime events from 2,646 confirmed thefts. Dividing a rounded $725 million estimate by the broad count gives about $201,700; that is not the average CargoNet reports. Conversely, the close product using 2,646 does not prove that all 2,646 thefts had individually observed values. Use the published mean with its source attribution rather than constructing a new measured average from mismatched fields.
The count-times-mean products rise by 59.7 percent. That is our calculation from the two products above, not an independently reproduced loss model. CargoNet separately reports an approximately 60 percent increase in estimated losses. Its displayed means, $202,364 and $273,990, calculate to a 35.4 percent increase, whereas its prose reports 36 percent; both statements are retained with their source or calculation label. 2
Broad event volume was nearly flat, but confirmed thefts were not. CargoNet reports 3,594 broad events in 2025 against 3,607 in 2024, while confirmed thefts increased from 2,243 to 2,646. The annual comparison therefore combines more confirmed thefts with a higher reported average; calling the loss increase solely a value story would erase the confirmed-count increase. 2
The confirmed share is climbing
One original calculation worth having. CargoNet publishes both its broad event count and its confirmed-theft subset. The ratio between them has moved consistently.
Table 5 — CargoNet's confirmed cargo theft share of total recorded events
| Period | Supply chain crime events | Confirmed cargo thefts | Confirmed share |
|---|---|---|---|
| 2024 | 3,607 | 2,243 | 62.2% |
| 2025 | 3,594 | 2,646 | 73.6% |
| Q1 2026 | 767 | 596 | 77.7% |
Source: Verisk CargoNet annual analysis, 21 January 2026 (2024 and 2025 figures); Verisk CargoNet Q1 2026 analysis, 23 April 2026. Shares computed by Lakeland Dock Door Repair Research from the published counts. Verified 15 September 2026.
Between the full years 2024 and 2025, the confirmed share rose 11.4 percentage points. Q1 2026’s share is 4.1 points above the 2025 full-year share, but one quarter is not a like-for-like comparison with an entire year. What changed is the composition of what CargoNet records. Whether that reflects better confirmation, different reporting behaviour, or a genuine shift in the mix of events is not something the published figures can settle, and we do not claim it does.
ATRI’s annualized industry-cost estimate
On 8 October 2025, the American Transportation Research Institute announced research on cargo theft using information from motor carriers, logistics service providers, insurers and other stakeholders. Its original announcement estimates annualized industry costs as high as $6.6 billion, or more than $18 million a day. 12
The same announcement reports average annual theft losses exceeding $520,000 for motor carriers and $1.84 million for logistics service providers. Those are the announcement’s annual organization-level figures—not average values per stolen shipment and not estimates for every carrier. 12
The distinction from CargoNet is essential. An annualized industry-cost estimate cannot be added to a provider’s estimated loss value or used as a later point in the same time series. The announcement identifies its research inputs, but it does not by itself let this compilation reproduce the full sample design, extrapolation or cost model.
The full model was not retrieved for this edition. Consequently, this page does not publish more detailed sample sizes, lower model bound, per-incident survey averages or fleet-risk calculation as verified findings. The reference is to the originating organization’s announcement, not to a secondary description of the report.
ATRI’s stated recommendations include model state legislation with specific cargo-theft penalties and a federal-level centralized reporting agency. Those are recommendations from the research announcement, not findings that the existing federal collection has ceased. 12
Where "$15–35 billion" actually comes from
The range appears in NICB material and testimony, but the attribution is not absent. NICB identifies DHS on its reference page; Glawe’s written testimony links the high-end estimate to ICE in footnote 6; Lemm’s written testimony identifies NICB in footnote 4. 13, 14, 25
We followed those references. They establish who attributed the estimate to whom—not the validity or completeness of an unpublished underlying calculation.
Table 6 — Provenance of the "$15–35 billion" cargo theft loss estimate
| Who publishes or cites it | Claim or treatment in the inspected evidence | Attribution actually supported | Where the trail goes |
|---|---|---|---|
| ICE / HSI, Operation Boiling Point | The federal page identified by NICB and Glawe as the attribution destination | Verified through those original documents, not by direct retrieval of the ICE page | The originating calculation was not retrieved; no claim that the live page contains no method |
| National Insurance Crime Bureau | Annual estimate of $15–35 billion; page also presents the $35 billion upper end | U.S. Department of Homeland Security | Page footnote links to Operation Boiling Point |
| David J. Glawe, NICB, written Senate testimony, 15 July 2025 | Annual cargo losses may reach up to $35 billion | Footnote 6 identifies ICE’s Operation Boiling Point | A source is supplied; the testimony does not reproduce an estimation model |
| Donna Lemm, IMC Logistics, written testimony at the same hearing | Describes a $15–35 billion annual U.S. cargo-theft industry | Footnote 4 identifies NICB | NICB is the stated attribution; this is not a new measured total |
| American Trucking Associations, 15 July 2025 statement | Describes costs to the supply chain up to $35 billion annually | The organization’s statement, not an original model reproduced here | Attribution to ATA is appropriate for what ATA stated; it does not independently verify the estimate |
| CNBC reporting | Not used as an originating numerical source in this compilation | No primary model independently reproduced from that reference | No CNBC-attributed federal total is entered as verified data |
| Supply Chain Dive reporting | Not used to establish what the inaccessible ICE page currently contains | The original testimony and NICB page are used directly instead | No claim that a particular outlet was the first or only source to investigate the estimate |
Source: NICB’s own cargo-theft page; Glawe’s written Senate testimony, page 5 and footnote 6; Lemm’s written testimony, page 2 and footnote 4; ATA’s 15 July 2025 statement. Checked 15 September 2026. The media-reference rows document excluded provenance routes, not verified loss observations. 13, 14, 25, 26
We are not saying the range is wrong. We can verify the attribution trail; we cannot reproduce the originating estimate from the material retrieved. A writer using it should identify the organization making or attributing the claim and retain the word estimate. Calling it an independently measured FBI loss total would go beyond this evidence.
The comparison with ATRI is useful only if the definitions remain separate. ATRI’s own announcement gives an annualized industry estimate and identifies research inputs. It does not supply this compilation with a complete model, and the numerical gap between two differently scoped estimates is not evidence that either one is false. No ratio between their endpoints is presented here as a crime finding.
Which states report the most cargo theft?
Across the compiled 2013–2019 FBI reports, Tennessee has the most reported cargo theft incidents (1,559) and Florida the highest reported stolen value ($160,719,860, or 54.7 percent of the printed national total). Those are rankings within the submitted and published data, not rankings of all theft nationwide. Florida’s value share is strongly influenced by its 2019 total. 4, 6, 7, 8, 9, 10, 11
Table 7 — FBI cargo theft by state, pooled 2013–2019, ranked by reported stolen value
| State | Years with a publishable incident | Incidents | Share of incidents | Value stolen | Share of value | Recovered-value share |
|---|---|---|---|---|---|---|
| Florida | 7 of 7 | 435 | 10.5% | $160,719,860 | 54.7% | 5.6% |
| Texas | 6 | 1,337 | 32.1% | $70,051,071 | 23.8% | 27.7% |
| Tennessee | 7 of 7 | 1,559 | 37.5% | $30,955,433 | 10.5% | 14.0% |
| Kentucky | 2 | 61 | 1.5% | $13,264,969 | 4.5% | 8.4% |
| Virginia | 6 | 80 | 1.9% | $4,316,321 | 1.5% | 41.2% |
| Michigan | 7 of 7 | 206 | 5.0% | $3,293,896 | 1.1% | 28.3% |
| Colorado | 6 | 49 | 1.2% | $2,228,088 | 0.8% | 11.7% |
| Delaware | 6 | 63 | 1.5% | $1,448,410 | 0.5% | 57.2% |
Source: Lakeland Dock Door Repair Research calculations from FBI Cargo Theft Table 1, 2013–2019, checked 15 September 2026. The complete pooled download contains 36 states plus Guam. Shares use the seven-year national totals in Table 2; a state’s recovered-value share uses that state’s own reported values. Unknown state-year values are flagged rather than replaced with zero. 4, 6, 7, 8, 9, 10, 11
Exactly three states — Florida, Michigan and Tennessee — reported at least one publishable cargo theft incident in all seven published years. No other state appears in all seven incident tables.
The period behind Florida’s 54.7 percent. Looking separately at 2013–2018 gives Florida $34,910,506, or 22.7 percent of that shorter period’s printed national total; Texas leads those six years at $65,169,472. These are different observation periods, not corrected versions of the same total. Florida’s 2019 value materially changes the pooled ranking, but the reports do not establish that it is erroneous or identify the exact state-by-property cells. The shorter-period comparison makes that concentration visible.
What this table is not. It is not a ranking of where cargo theft happens. It is a ranking of where cargo theft was reported, validated and published, by states whose agencies chose to submit. The numbers of agencies supplying incident rows vary materially across states and years. For example, Texas’s included years range from 23 to 56 agencies and Florida’s seven years from 9 to 24. The tables do not quantify how much of a state’s position reflects reporting coverage rather than theft, so neither factor is assigned an unsupported share of the explanation.
What the private trackers say about states
The two commercial trackers produce a different state picture from the federal record, and from each other. Both are shown here because both get quoted; neither should be merged with the FBI series or with the other.
Table 7a — CargoNet state incident counts, first quarter 2025 against first quarter 2026
| State | Q1 2025 | Q1 2026 | Change |
|---|---|---|---|
| California | 255 | 277 | +8.6% |
| Texas | 102 | 80 | −21.6% |
| New Jersey | 27 | 59 | +118.5% |
Source: Verisk CargoNet, "2026 First Quarter Supply Chain Risk Trends Analysis," 23 April 2026. Both quarters use CargoNet's matched 14 April reporting cutoffs. Percentage changes computed by Lakeland Dock Door Repair Research from the published counts. These are changes in incidents recorded by one network, not exposure-adjusted risk rates. Verified 15 September 2026.
Table 7b — Overhaul state shares verified from its Q1 2026 U.S. release
| State | Share of Overhaul’s 574 U.S. incidents, Q1 2026 | Verification boundary |
|---|---|---|
| California | 36% | Stated by Overhaul |
| Texas | 17% | Stated by Overhaul |
| Tennessee | 12% | Stated by Overhaul |
| Illinois | 13% | Stated by Overhaul |
| Pennsylvania | Not stated in the inspected release | Not zero; no share entered |
| Georgia | Not stated in the inspected release | Not zero; no share entered |
Source: Overhaul’s issuer-authored Q1 2026 release, 18 May 2026, checked 15 September 2026. This is a quarterly table, not the unverified detailed 2025 annual breakdown. Shares are source-rounded; they must not be multiplied back into purported exact incident counts. 27
Three distinctions a writer can use. Tennessee leads reported incidents in the historical FBI compilation, while California has the largest share among the states listed in Overhaul’s Q1 2026 release. Florida’s large historical FBI value share is a different metric again. None of those observations establishes which state has the greatest per-shipment risk.
The Overhaul annual overview verifies its 2025 U.S. total, but the detailed annual state table was not independently retrieved for this edition. The six state rows remain here with the scope that can be supported by primary material; the two absent quarterly shares are left unfilled rather than carried over from another period or a secondary article.
What kinds of cargo get stolen?
CargoNet recorded 80 metals-related incidents in Q2 2026 against 54 in its matched Q2 2025 comparison, and 144 food-and-beverage incidents in Q1 2026, its largest category that quarter. These are category counts from one provider’s U.S.-and-Canada reports, not market-wide theft probabilities. The FBI’s older property-value table uses different categories and a different reporting population, so it cannot establish the same contemporary product trend. 17, 20
Table 8 — CargoNet commodity category counts, matched quarters
| Commodity category | Earlier quarter | Later quarter | Change |
|---|---|---|---|
| Personal care and beauty | 18 (Q1 2025) | 50 (Q1 2026) | +178% |
| Building materials | 21 (Q1 2025) | 8 (Q1 2026) | −62% |
| Metals | 54 (Q2 2025) | 80 (Q2 2026) | +48% |
| Food and beverage | — | 144 (Q1 2026) | Largest Q1 2026 category |
Source: CargoNet Q1 2026 analysis, 23 April 2026, and Q2 2026 analysis, 6 August 2026; verified 15 September 2026. Changes calculated from the paired counts and rounded to whole percentages. The inspected Q1 release does not give a matched Q1 2025 count for the 144 food-and-beverage incidents. The Q2 metals baseline of 54 is the later release’s comparator, not the 53 in the original Q2 2025 snapshot. 17, 20, 28
CargoNet attributes the personal care increase to cosmetics and fragrances, predominantly in the Northeast, and the metals increase to copper alongside aluminium, nickel and tungsten. Its Q2 release describes elevated losses associated with high-value technology shipments, including enterprise computing components and cryptocurrency-mining equipment. Those statements describe the publisher’s observed pattern; they do not establish that all technology cargo has the same risk or that a specific protective measure caused the change. 17, 20
The FBI’s 2019 value table should be read on its own terms. “Recordings” dominates its reported dollar total; other categories include consumable goods, computer hardware, trucks and clothing. Property value, incident frequency and ease of resale are different questions, and the table does not by itself establish a resale-market explanation. 4
What happened to the FBI's 2019 numbers?
The FBI’s 2019 “Recordings” property category contains $120,033,130 in reported stolen value and $0 recovered, accounting for 85.9 percent of that year’s national stolen value. The same category was $500 in 2018. This concentration materially affects the dollar-weighted recovery share, but the published tables do not establish an error or justify deleting the category from the official total. 4, 10
Here is the arithmetic, and all of it is reproducible from two tables in one PDF.
The size of it. National stolen value for 2019 was $139,677,562. The Recordings line is $120,033,130 of that — 85.9 percent. 4
What the two tables permit algebraically. Florida’s 2019 reported stolen value is $125,809,354, or 90.1 percent of the national total; the remaining jurisdictions sum to $13,868,208. If the state and property tables consistently partition the same stolen-value total, at least $106,164,922 of the $120,033,130 “Recordings” category—88.5 percent—would have to fall within Florida: the category value minus all non-Florida value. This is a conditional lower bound, not a published Florida-by-property observation, not an incident count and not an independent validation of the underlying valuations. The published report supplies no state-by-property cross-tabulation from which the actual cell can be read. 4
What it does to the recovery rate. This is the part that matters most, because recovery rates get quoted.
Table 9 — FBI recovered-value shares and an exclusion sensitivity test for the 2019 “Recordings” category
| Year | Stolen | Recovered | Recovered-value share, calculated | Sensitivity: excluding 2019 “Recordings” value |
|---|---|---|---|---|
| 2014 | $32,591,534 | $7,707,357 | 23.6% | 23.6% |
| 2015 | $27,872,130 | $5,492,273 | 19.7% | 19.7% |
| 2016 | $26,933,356 | $8,449,949 | 31.4% | 31.4% |
| 2017 | $21,721,702 | $5,731,104 | 26.4% | 26.4% |
| 2018 | $33,043,046 | $7,538,754 | 22.8% | 22.8% |
| 2019 | $139,677,562 | $3,848,816 | 2.8% | 19.6% |
| 2013–2019 pooled | $293,806,640 | $40,903,863 | 13.9% | 23.5% |
Source: FBI Cargo Theft Tables 1 and 2, 2013–2019; calculations checked 15 September 2026. The sensitivity column subtracts $120,033,130 from the 2019 and pooled stolen-value denominators and removes $0 from the recovered-value numerator. Earlier years remain unchanged. This is not an official adjustment or a finding that the category should be excluded. 4, 6, 7, 8, 9, 10, 11
The calculated 2019 recovered-value share is 2.8 percent with all reported property included and 19.6 percent with that category excluded. The sensitivity result is close to 2015’s 19.7 percent; it shows the influence of one category on an aggregate, not that underlying recovery performance was unchanged.
The valid finding is concentration, not error. A very large category with no reported recoveries reduces the dollar-weighted share. The report does not show whether that category represents one incident or many, why its value was high, or whether its valuation was later revised.
We do not know the underlying incidents behind the category. We do not speculate, and we do not adjust the headline totals: Table 2 retains the FBI’s printed national values. The sensitivity appears only as a separately labelled analysis; a quotation of the published recovery share should use the all-category figure, and a quotation of the sensitivity must identify the exclusion.
Where is cargo theft reported to happen?
Across the six FBI location tables for 2014–2019, harmonized parking-lot/drop-lot/garage entries account for 1,558 of 4,168 location entries—37.4 percent, the largest pooled category. Highways and streets account for 11.5 percent, commercial and office buildings 9.1 percent, and dock/wharf/freight/modal terminals 7.6 percent. These are reported location entries, not unique facilities, incidents or exposure-adjusted location risks. 4, 7, 8, 9, 10, 11
The pooled table is accompanied by every individual year in the download. The parking share ranges from 30.6 percent to 42.7 percent across the six tables; pooling describes their combined composition rather than proving that the same pattern holds in every year or agency. A single-year figure remains usable when its year and denominator are retained.
Table 10 — FBI cargo theft by location type, six published tables pooled, 2014–2019
| Location type | Location entries | Share of 4,168 entries |
|---|---|---|
| Parking, drop lot, garage | 1,558 | 37.4% |
| Highway, road, alley, street, sidewalk | 480 | 11.5% |
| Commercial, office building | 381 | 9.1% |
| Dock, wharf, freight, modal terminal | 316 | 7.6% |
Source: Lakeland Dock Door Repair Research compilation of FBI Cargo Theft Table 3, 2014–2019; checked 15 September 2026. The 2013 release has no location table. The reports record locations for offences, so the pooled location denominator is not the unique-incident total. Earlier parking-lot/garage labels and later parking/drop-lot/garage labels are harmonized; other wording changes are documented in the methodology. All transcribed categories and original-label fields are included in the download. 4, 7, 8, 9, 10, 11
Overhaul’s detailed 2025 location breakdown was not independently retrieved, so no annual warehouse or truck-stop percentage from secondary coverage is carried into this table. Its incident series and the FBI’s offence-location table would need definition and denominator checks before any side-by-side comparison could be interpreted as the same measure. The absence of a verified private-provider location percentage here does not make the historical FBI category shares current risk estimates.
This table describes where thefts were recorded. It is not a guide to where security is weakest, and nothing here should be read as one.
What legally counts as cargo theft?
Two definitions are relevant to this page: the FBI’s statistical cargo-theft definition and Florida’s cargo-in-commerce theft-grading provisions. They do different jobs: one classifies reported crime, while the other specifies offence grades under state law. They are not an exhaustive account of every federal or state cargo-theft law. 4, 18
The federal measurement definition
The FBI's UCR Program defines cargo theft as:
"The criminal taking of any cargo including, but not limited to, goods, chattels, money, or baggage that constitutes, in whole or in part, a commercial shipment of freight moving in commerce, from any pipeline system, railroad car, motor truck, or other vehicle, or from any tank or storage facility, station house, platform, or depot, or from any vessel or wharf, or from any aircraft, air terminal, airport, aircraft terminal or air navigation facility, or from any intermodal container, intermodal chassis, trailer, container freight station, warehouse, freight distribution facility, or freight consolidation facility."
The reports add that cargo is "moving in commerce at all points between the point of origin and the final destination, regardless of any temporary stop while awaiting transshipment or otherwise," and that the legal elements of knowledge and intent were deliberately left out because this is a counting definition, not a charging one. 4
Two features are worth noting. Warehouses, freight distribution facilities and freight consolidation facilities are inside the definition — theft from a building counts, not only theft from a truck. And cargo theft is not an offence in itself in the FBI's system: it is a flag attached to another offence. In 2019 the offences carrying that flag were led by theft from motor vehicle (322), all other larceny (251), motor vehicle theft (92) and burglary (48). 4
Florida grades cargo theft dock to dock
Florida’s theft statute, § 812.014, treats qualifying cargo in commerce as a distinct property category and identifies the shipper’s loading platform and consignee’s receiving dock as the endpoints. Cargo qualifies when it has "entered the stream of interstate or intrastate commerce from the shipper's loading platform to the consignee's receiving dock." 18
Table 11 — Florida theft grading: cargo in the stream of commerce compared with ordinary property
| Property class | Value | Offence grade | Citation |
|---|---|---|---|
| Cargo in the stream of commerce | $50,000 or more | Grand theft, first degree | § 812.014(2)(a)2. |
| Cargo in the stream of commerce | Any value below $50,000 | Grand theft, second degree | § 812.014(2)(b)2. |
| Default value-based category* | $100,000 or more | Grand theft, first degree | § 812.014(2)(a)1. |
| Default value-based category* | $20,000 to under $100,000 | Grand theft, second degree | § 812.014(2)(b)1. |
| Default value-based category* | $750 to under $20,000 | Grand theft, third degree | § 812.014(2)(c)1.–3. |
| Default value-based category* | $100 to under $750 | Petit theft, first degree (misdemeanour) | § 812.014(2)(f) |
| Default value-based category* | Under $100, not otherwise specified | Petit theft, second degree (misdemeanour) | § 812.014(3)(a) |
| Organizing, planning, financing, directing, managing, or supervising one or more other persons in theft | More than $3,000 stolen | Felony of the second degree | § 812.014(6) |
Source: 2026 Florida Statutes, § 812.014, read at the Florida Senate’s official site on 15 September 2026. *Default value-based rows are not exhaustive: special property categories, dwelling-related provisions, prior offences and other statutory conditions can change the grade. This table states the cited clauses’ value rules, not every possible charge or enhancement. Sentencing terms are not reproduced. 18
The cargo-under-$50,000 clause states no minimum value. That is different from the default second-degree grand-theft value band, which begins at $20,000. But the cargo rule is not a statement that every theft of property outside a trailer receives the lowest grade: the statute separately addresses particular property types, theft from dwellings and other circumstances. 18
The defensible comparison is between the cited statutory clauses, not an invented multiplier or an inference about legislative motive. Qualifying cargo below $50,000 falls within the cited second-degree clause; qualifying cargo at or above $50,000 falls within the cited first-degree clause. Whether the legal elements and any other provisions apply to a particular case is a separate question. 18
What do Florida and Polk County’s cargo-theft records show?
Florida appears in all seven compiled FBI incident tables and accounts for 54.7 percent of their pooled reported stolen value, with a large contribution from 2019. Separately, Florida’s Attorney General and Polk County Sheriff’s Office have published identifiable cargo-theft investigation accounts. Those accounts describe particular investigations, not complete annual totals for Florida, Lakeland or Polk County. 4, 6, 7, 8, 9, 10, 11, 22, 23
The state enforcement record
On 12 February 2026, the Florida Attorney General announced charges against six people in an alleged organized cargo-theft operation. The stated charges were grand theft and conspiracy to commit grand theft. The announcement is evidence of what the agency alleged at that time, not a finding that the defendants were guilty or a statement about their later case dispositions. 22
The particulars in the Attorney General’s release are:
- At least 32 cargo theft incidents and one vessel theft in the described investigation.
- Six named counties: Orange, Broward, Polk, Osceola, St. Lucie and Volusia.
- Nearly $7.8 million in estimated losses, as stated by the agency.
- A related investigative description from the Florida Highway Patrol Cargo Theft Unit referring to approximately 51 commercial motor vehicles and 28 cargo shipments between May 2023 and March 2025.
Those figures count different things. Cargo incidents, vehicles, shipments and a vessel are not interchangeable units, and adding them would double-count elements of the same investigation. The release does not allocate an annual incident total to each county.
The listed cargo includes retail merchandise, consumer electronics, copper wire, HVAC equipment, cooking oil, food products, energy drinks, wine and spirits. The agency describes cargo in the stream of interstate or intrastate commerce—the condition relevant to Florida’s cargo-specific grading provisions. This is a summary of the allegations, not a guide to theft methods. 18, 22
The defendants are not named here because their identities are unnecessary to the statistical point. Their later legal outcomes have not been checked for this dataset; the date and allegation status remain attached to the investigation figures.
Polk County has an earlier, separate agency account. On 29 November 2021, the Sheriff’s Office described an investigation involving 25 semi-trailers taken during May–July 2021, with businesses in Winter Haven and Auburndale among those affected. Two trailers were reportedly empty, so the incident must not be described as 25 loaded trailers. 23
The release’s headline references approximately $704,487 in its description of pallets and trailers, while its body gives $935,663 as the combined trailer-and-pallet value. Those are retained as differently presented figures from the same announcement, not silently collapsed into one cargo-only loss estimate. The release also states that the trailers were recovered. It is a historical investigation account, not a Polk County annual theft figure. 23
Why no newer local annual total is entered here
The Florida Department of Law Enforcement maintains a Cargo Theft Crimes page in its Uniform Crime Reports material. The inspected page embeds a government-hosted interactive dashboard. Its annual values were not independently extracted and reproduced in this verification pass. 24
That is an access and verification boundary for this compilation—not evidence that FDLE has no data, that dashboard exports are impossible, or that the data cannot be cited. An exact figure would need its selected year, county or agency filter, unit, coverage notes and retrieval date recorded before being added here.
No newer annual Florida or Polk County total from that dashboard is entered in this edition. Historical Florida figures from the 2013–2019 FBI reports are included and remain identified as such. Missing is not zero, and a single investigation is not a substitute for a countywide annual total.
What the corridor context establishes
Lakeland is in Polk County between Tampa and Orlando along the Interstate 4 corridor. The city’s own published descriptions support that geography; they do not provide a cargo-theft rate. 37
Polk is one of the counties named in the 2026 Attorney General’s announcement, but the release does not establish where inside the county each incident occurred or how the county compares with the rest of Florida. Likewise, CargoNet’s Q2 2026 discussion of reduced activity in South Florida does not measure Polk County or the I-4 corridor. Geographic proximity cannot fill that evidence gap. 17, 22
This local section links the national reference to its home region through official records. It does not turn the site’s location, warehouse activity or a past case into an unsupported claim about local theft risk.
Is cargo theft rising or falling?
The answer depends on the provider, period and measure. CargoNet’s 2025 broad event count was nearly flat, while its confirmed cargo thefts increased 18 percent; in Q2 2026, Overhaul reported a quarterly count increase and CargoNet a decrease using its own comparison snapshot. Those are reported database trends, not one harmonized national crime-growth rate. 2, 16, 17
What CargoNet’s annual figures show. Its reported mean theft value went from $187,895 in 2023 to $202,364 in 2024 and $273,990 in 2025—a 45.8 percent increase across the two endpoints, calculated from the displayed values. These are published means from their stated vintages, not a shipment-risk index. The 2024–2025 displayed means calculate to +35.4 percent; CargoNet’s prose gives +36 percent, a difference retained rather than smoothed away. 2, 15
What the quarterly loss figure shows. CargoNet estimates $304.6 million in Q2 2026 losses and reports a $564,009 average among thefts with a reported commodity value. The release attributes the high mean to a small number of extreme losses. It does not disclose a median or establish that a typical theft involved $564,009. 17
What selected event classifications show. CargoNet’s Q2 comparison lists events labelled theft falling from 488 in Q2 2025 to 378 in Q2 2026, while fictitious pickups fell from 165 to 158. Those selected categories both declined in the comparison; their relative movement is not proof that all cargo crime shifted from force to fraud. The categories are not presented here as a complete partition of every recorded incident. 17
The FBI’s April 2026 advisory separately discusses cyber-enabled strategic cargo theft involving deception and compromised business communications. It supports describing that threat, but does not supply this page with a complete statistical distribution of theft methods. Operational details are unnecessary to the measurement comparison and are not reproduced. 1
What remains unresolved. Overhaul’s Q2 2026 overview states a year-over-year decline, while its earlier Q2 2025 count produces an increase when compared with the newer count. CargoNet’s quarterly releases also use different comparison cutoffs from the earlier snapshot totals. The vintage analysis preserves both issues; neither should be converted into a clean year-over-year chart without reconciliation. 16, 17, 28, 29
What cannot be inferred here. The probability that any U.S. shipment, truck or facility suffers theft is not calculated from these totals. A valid exposure-adjusted rate requires a numerator and denominator covering the same population and period. Freight datasets exist, but no matched exposure denominator is joined to these provider or agency counts in this edition. 35
Why does the measurement gap matter for public policy?
Cargo theft has been discussed in federal legislation, Senate testimony and an FBI advisory, but those documents use different kinds of evidence. A legislative proposal, a witness’s loss estimate and an agency’s incident table must retain their own status and source; one does not validate the others merely by repeating a figure. 1, 14, 25, 33
The committee-reported version dated 30 January 2026 of H.R. 2853, the Combating Organized Retail Crime Act of 2025, proposes an Organized Retail and Supply Chain Crime Coordination Center within Homeland Security Investigations at ICE. Its scope includes organized retail and supply-chain crime, not cargo theft alone. This paragraph describes that dated legislative version, not a claim that the proposal is enacted law or a current-status update beyond the inspected record. 33
ATRI’s 8 October 2025 research announcement recommends developing a federal-level centralized cargo-theft reporting agency. The Association of American Railroads’ 10 April 2025 statement supporting the legislation estimates that theft cost major railroads more than $100 million in 2024. The former is a recommendation and the latter an industry estimate; neither is added to CargoNet’s losses or the FBI’s reported values. 12, 34
The older federal mandate is separately verifiable. Public Law 109–177 required cargo theft to be reflected as a separate UCR category, and the FBI reports explain the subsequent statistical collection. The historical archive inspected here ends with 2019, while newer FBI data access is directed to the Crime Data Explorer. That does not prove that the federal reporting obligation went unfulfilled after 2019. 3, 4, 5, 32
The useful contribution of this compilation is narrower: it joins historical reports, exposes internal accounting differences, labels current provider snapshots and keeps unverified later extracts out of the totals. That makes the evidence easier to inspect without converting limitations in this research pass into allegations about an agency’s conduct.
What can these figures not establish?
The figures on this page do not establish all cargo theft nationwide, a unique combined total across providers or a shipment’s probability of theft. Each observation retains a source population, geography and date; each original calculation is limited by those inputs.
No complete crime census. FBI and provider counts are reports captured by particular collections. The annualized cost estimates are estimates, not exhaustive incident lists. Their totals do not measure the same thing.
No exposure-adjusted risk rate. This compilation does not join a matched shipment, truck, facility or dock denominator to its incident counts. Official freight datasets exist, but a broad exposure total cannot simply be divided into a selective reporting numerator. 35
No addition across sources. Events may overlap across FBI, CargoNet and Overhaul collections. Without event-level deduplication and compatible definitions, adding the totals would not yield unique thefts.
No unqualified comparison across territories. CargoNet’s headline figures used here cover the United States and Canada. Overhaul’s selected headline counts are U.S.-only. The historical FBI compilation includes the jurisdictions listed in each report, including Guam in 2015; participation is not complete national coverage.
No silent mixing of cutoff dates. CargoNet’s later comparisons can use updated prior-period snapshots. A previously published count does not necessarily reproduce a later stated percentage. Overhaul’s unresolved Q2 year-over-year comparison is also identified in the vintage register. 16, 17, 20, 28, 29
Estimates are not measurements. CargoNet labels its losses as estimates. ATRI describes annualized industry costs. The originating calculation behind the DHS-attributed $15–35 billion range was not verified here. An attributable estimate is not an independently reproduced model. 2, 12, 13, 14
Restricted value denominators. CargoNet’s Q2 2026 mean applies to thefts with reported commodity values and is influenced by extreme losses. The disclosed summary does not supply a median or the count of valued observations needed to characterize a typical case. 17
Reported composition is not incidence. State shares reflect included reporting; location shares count offence-location entries; property shares count dollars. None is automatically the share of all national thefts, individual shipments or facilities.
Large-category concentration is not proof of error. The FBI’s 2019 “Recordings” category heavily influences the stolen-value and recovered-value totals. The exclusion calculation is a sensitivity test, not a repaired dataset. The conditional Florida lower bound depends on consistent state/property accounting and is not an observed cross-tabulated cell. 4
Percentage changes on small or undisclosed bases. A large state or county percentage change without exposure data is not a per-shipment risk rate. Where the provider supplies no baseline incident count, a percentage alone is not an absolute burden ranking.
Internal reconciliation differences remain visible. The FBI’s 2013 recovered-value rows sum $3,000 above the printed total; the 2014 known stolen-value rows sum $1 below the printed total, with an unknown state value retained. National totals are not silently altered to make either check pass. 6, 7
Legal and investigation boundaries. The Florida table summarizes cited statutory grading provisions, not every exception, enhancement or charging decision. Agency investigation announcements establish what was alleged when published; they do not establish convictions or countywide annual rates. 18, 22, 23
Which figures or underlying details were not verified?
Unverified numerical candidates are excluded from the published data, not presented as provisional facts. The following boundaries identify what this edition does not establish and which underlying material would be needed to expand it.
- Newer Florida and Polk County annual totals from FDLE. The official cargo-theft dashboard was located, but its filtered annual values were not independently extracted. The historical Florida figures already in the FBI compilation remain available; no missing contemporary value is entered as zero.
- Post-2019 FBI Crime Data Explorer cargo-theft extracts. No later federal cargo-theft file was independently reproduced here. No secondary newsroom total is presented as a verified current FBI count, and no growth calculation is built from such a total.
- CargoNet’s complete annual loss-estimation model. Both original annual graphics were inspected and their exact published totals are included. The count-times-rounded-mean products do not independently establish the full method. The 2024 difference and the displayed-mean growth discrepancy remain visible.
- Overhaul’s detailed 2025 annual state and location tables. Its own annual overview verifies the U.S. total used here, but the detailed annual report was not retrieved. The state comparison instead uses the organization’s directly verified Q1 2026 release and explicitly leaves unreported shares unfilled.
- Overhaul’s reconciled Q2 2025 comparator. The Q2 2026 overview’s stated annual decline does not reconcile with the earlier Q2 2025 overview count. No exact revised baseline or reason is inferred.
- ATRI’s full model, sample design and detailed survey results. The original announcement verifies the annualized upper estimate and annual loss figures summarized here. Detailed sample counts, a lower model endpoint and per-incident survey rates are not entered without the full primary research.
- The live ICE Operation Boiling Point page and originating estimate calculation. The NICB and Glawe attribution paths were verified directly. That is not a claim that the inaccessible live ICE page was read or that no model exists anywhere.
- The complete Senate hearing transcript. The two witnesses’ original written testimonies were inspected, including their estimate footnotes. Their written statements are not described as a complete transcript of oral testimony or questioning.
- The full Journal of Applied Security Research article. The publisher’s abstract was reviewed; the full study was not. The discussion is limited to what the abstract states.
- Sentencing terms under Florida law. The offence-grading clauses in § 812.014 were checked, but maximum terms of imprisonment and case-specific sentencing outcomes are not reproduced.
- The first enactment date of Florida’s cargo-specific language. The current inspected statute supports the grading table. This edition does not identify the original session law or claim that a particular threshold has remained unchanged since a specified historical year.
- An inflation-adjusted Florida cargo threshold. No price-index series or adjustment method was applied. The statutory dollar thresholds are nominal legal thresholds, not inflation-adjusted amounts.
These are research limits, not assertions that the missing information is inaccessible to everyone or does not exist. A future edition can add an observation only after its source, period, definitions and calculation have been checked.
What is the attribution reference for this page?
The reference below identifies this compilation and its version. Underlying observations remain attributed to the organizations that published them; the compilation and explicitly labelled calculations are the work of Lakeland Dock Door Repair Research.
Publication: Lakeland Dock Door Repair Research
Page title: Cargo Theft Statistics 2026: Seven Years of FBI Data and Who Publishes the Rest
URL: https://lakelanddockdoorrepair.com/research/cargo-theft-statistics/
Dataset version: 1.2-2026-09-15
Last verified: 15 September 2026
An unchanged FBI, CargoNet, Overhaul or ATRI observation retains that organization’s source attribution. A cross-year sum, harmonized location share or sensitivity calculation is identified as a calculation by this publication from named source inputs. Attribution does not convert an estimate into a measurement or an exclusion sensitivity into an official revision.
Sections, tables and individual key statistics have stable anchors. The dataset preserves source URLs, verification dates, input values and calculation labels so a particular finding can be distinguished from the rest of the page.
What is included in the downloadable dataset?
The download contains the checked historical FBI compilation, selected current provider observations, attribution and statutory tables, and the script that reproduces the calculations. It is an aggregate evidence package—not incident-level CargoNet or Overhaul data and not a full copy of every underlying report.
Complete dataset ZIP · Complete structured JSON
fbi-cargo-theft-national-2013-2019.csv — annual printed national totals, reporting-agency counts, calculated recovered-value shares, source-labelled participation counts, actual state/territory row counts and source URLs.
fbi-cargo-theft-by-state-2013-2019.csv — all 130 jurisdiction-year rows: year, state or territory, agency count, incident count, stolen and recovered value, unknown-value flags, calculated shares and primary source.
fbi-cargo-theft-state-pooled-2013-2019.csv — 36 states plus Guam: included years, pooled incidents, sums of known stolen and recovered values, completeness flags, recovered-value shares and the all-seven-years indicator.
fbi-cargo-theft-locations-2014-2019.csv — all transcribed categories in six location tables, source-era and harmonized labels, annual counts, annual denominators and a pooled block.
cargo-theft-tracker-reconciliation.csv — the source-specific measures, geography, source-product boundaries and publisher context summarized in Table 3.
cargo-theft-quarterly-series.csv — selected quarter, provider, count, source measurement label, geographic scope, disclosed comparison cutoff and original publication URL.
cargo-theft-publication-vintage.csv — annual snapshots, quarterly comparison cutoffs and the unreconciled Overhaul comparison, with source statements kept separate from calculations.
cargo-theft-loss-estimate-provenance.csv — primary attribution routes, inspected testimony footnotes and the boundary between a verified attribution and an unverified model.
florida-theft-grading-ladder-812-014.csv — property class, value condition, statutory grade, exact subsection, 2026 source URL and the scope limitations accompanying Table 11.
cargo-theft-source-ledger-v1.2.json — the complete structured compilation, source register, calculation inputs, data-quality checks and verification key.
build_dataset.py — portable Python standard-library builder. Its input file, cargo-theft-verified-inputs.json, is included in the ZIP and carries the checked snapshot from which outputs are regenerated.
Additional audit-ready tables: selected FBI property values, derived findings and formulas, annual reconciliation checks, and selected provider observations.
Blank numeric CSV cells and JSON null values mean unknown or not entered, not zero. Estimated losses, source-reported percentages, calculated percentages and conditional sensitivity findings retain distinct labels. Downloading the package requires no form or account.
The files are a dated snapshot. Re-running the script repeats the stored arithmetic; it does not turn the snapshot into current live data or verify later changes at the source.
What are the answers to common cargo-theft statistics questions?
These answers use the same definitions and source dates as the tables above. A count, estimate, average and recovered-value share remain different measures even when they appear together in one answer.
How many cargo thefts happen in the United States each year?
There is no complete annual national theft census established by this compilation. The inspected FBI historical report contains 721 incidents for 2019; CargoNet reports 2,646 confirmed thefts across the United States and Canada for 2025, and Overhaul’s own annual overview reports 2,576 U.S. events for 2025. Those source-specific counts must not be added, and no post-2019 FBI extract was independently reproduced here. 2, 4, 21
Does the $725 million figure cover only the United States?
No. CargoNet’s estimate of nearly $725 million for 2025 covers the United States and Canada; its original graphic gives $724,978,757. The count-times-rounded-mean calculation comes close to that number but does not independently establish the provider’s full loss-estimation method. 2, 30
Is the $15–35 billion cargo theft figure reliable?
This compilation verifies an attribution chain, not the originating model. NICB attributes the annual range to DHS, Glawe’s written Senate testimony cites ICE, and Lemm’s testimony cites NICB; the underlying calculation was not retrieved. Retain the word estimate and identify the organization making or attributing the claim rather than presenting it as an independently measured FBI total. 13, 14, 25
Why do CargoNet and Overhaul report different numbers?
They report separate collections with different geographic scopes and comparison snapshots. CargoNet’s selected figures cover the United States and Canada; Overhaul’s headline counts used here cover the United States. For Q2 2026, Overhaul reports a 5 percent quarterly increase while CargoNet reports a 14 percent decrease against its own comparator; there is no event-level crosswalk in this compilation that reconciles their totals. 16, 17
Does the FBI still track cargo theft?
The FBI’s UCR materials define a cargo-theft reporting category and direct newer crime-data access to the Crime Data Explorer. The historical Cargo Theft archive inspected for this page ends with the 2019 report; that archive boundary does not establish that later data or products do not exist. This edition reproduces the seven historical reports, not a contemporary cargo-theft extract. 3, 4, 5
Is the average cargo theft really $273,990?
That is CargoNet’s reported 2025 average for its U.S.-and-Canada reporting, not a universal typical-loss figure. Its Q2 2026 mean of $564,009 applies specifically to thefts with a reported commodity value, and the publisher says a small number of extreme losses influenced it. Neither figure is a median or the probability-weighted loss for an arbitrary shipment. 2, 17
Are Florida or Polk County annual cargo theft totals available?
This page includes historical Florida figures from the FBI’s 2013–2019 reports. FDLE also maintains an official cargo-theft dashboard, but no newer annual Florida or Polk value from it was independently extracted for this edition. Investigation announcements are described separately and must not be substituted for complete annual totals; an unentered value is not zero. 4, 6, 7, 8, 9, 10, 11, 22, 23, 24
Which state has the most cargo theft?
Within the compiled FBI 2013–2019 reports, Tennessee has the most recorded incidents (1,559 of 4,162), while Florida has the highest reported stolen value ($160,719,860, or 54.7 percent of the printed national total). Florida’s share is strongly influenced by 2019. Those are rankings within a changing reporting population, not exposure-adjusted rankings of all theft nationwide. 4, 6, 7, 8, 9, 10, 11
Which primary sources support this page?
The source list identifies the documents, original graphics and agency or issuer-authored pages used in this compilation. Verification date: 15 September 2026; a source note distinguishes a directly checked observation from an overview, abstract, attribution-only reference or data-access destination that was not extracted.
1. FBI Internet Crime Complaint Center, “Cyber-Enabled Strategic Cargo Theft Surging,” 30 April 2026.
https://www.ic3.gov/PSA/2026/PSA260430
Checked 15 September 2026. Original agency advisory; figures checked.
2. Verisk CargoNet, 2025 annual cargo-theft analysis, 21 January 2026.
https://www.cargonet.com/news-and-events/cargonet-in-the-media/2025-theft-trends/
Checked 15 September 2026. Original annual release; counts, means and cutoffs checked.
3. FBI, UCR Publications historical archive.
https://www.fbi.gov/how-we-can-help-you/more-fbi-services-and-information/ucr/publications
Checked 15 September 2026. Archive listing checked; not an exhaustive inventory of all FBI data.
4. FBI, Cargo Theft, 2019.
https://ucr.fbi.gov/crime-in-the-u.s/2019/crime-in-the-u.s.-2019/additional-data-collections/cargo-theft/cargo-theft.pdf
Checked 15 September 2026. National, state, property, location and methodology material checked.
5. FBI, Crime Data Explorer.
https://cde.ucr.cjis.gov/LATEST/webapp/#/pages/downloads
Checked 15 September 2026. Official data-access destination identified through FBI materials; no post-2019 cargo extract reproduced.
6. FBI CJIS Division, Cargo Theft Update, April 2015; 2013 data.
https://ucr.fbi.gov/cargo-theft-update
Checked 15 September 2026. National and state data checked; the $3,000 recovered-value discrepancy is retained.
7. FBI, Cargo Theft, 2014.
https://ucr.fbi.gov/cargo-theft-2014
Checked 15 September 2026. Annual and table data checked; unknown Hawaii value retained.
8. FBI, Cargo Theft, 2015.
https://ucr.fbi.gov/crime-in-the-u.s/2015/crime-in-the-u.s.-2015/additional-reports/cargo-theft/cargotheft-report_2015_final-1.pdf
Checked 15 September 2026. Annual and table data checked; Guam identified as a territory.
9. FBI, Cargo Theft, 2016.
https://ucr.fbi.gov/crime-in-the-u.s/2016/crime-in-the-u.s.-2016/additional-publications/cargo-theft/cargo-theft.pdf
Checked 15 September 2026. Annual and table data checked.
10. FBI, Cargo Theft, 2018.
https://ucr.fbi.gov/crime-in-the-u.s/2018/crime-in-the-u.s.-2018/additional-data-collections/cargo-theft/cargo-theft.pdf
Checked 15 September 2026. Annual, location and selected property data checked.
11. FBI, Cargo Theft, 2017.
https://ucr.fbi.gov/crime-in-the-u.s/2017/crime-in-the-u.s.-2017/additional-data-collections/cargo-theft/cargo-theft.pdf
Checked 15 September 2026. Annual and table data checked.
12. American Transportation Research Institute, “New ATRI Research Confirms the High Costs of Cargo Theft to Industry,” 8 October 2025; issuer-authored release.
https://www.prnewswire.com/news-releases/new-atri-research-confirms-the-high-costs-of-cargo-theft-to-industry-302578463.html
Checked 15 September 2026. Original research announcement checked; full model not retrieved.
13. National Insurance Crime Bureau, cargo-theft reference page.
https://nicb.org/prevent-fraud-theft/cargo-theft
Checked 15 September 2026. Page and DHS attribution footnote checked; underlying federal model not reproduced.
14. David J. Glawe, NICB, written testimony to the Senate Judiciary Committee, 15 July 2025; page 5, footnote 6.
https://www.judiciary.senate.gov/download/08/06/2025/2025-07-15_-testimony_-glawepdf
Checked 15 September 2026. Original written testimony checked; it explicitly cites ICE.
15. Verisk CargoNet, 2024 Supply Chain Risk Trends Analysis, 21 January 2025.
https://www.cargonet.com/news-and-events/cargonet-in-the-media/2024-theft-trends/
Checked 15 September 2026. Original annual snapshot checked.
16. Overhaul, United States Cargo Theft Report, Q2 2026 overview.
https://www.over-haul.com/reports/us-cargo-theft-report
Checked 15 September 2026. Public overview checked; rolling URL, with annual-comparison conflict retained.
17. Verisk CargoNet, Q2 2026 cargo-theft analysis, 6 August 2026.
https://www.cargonet.com/news-and-events/cargonet-in-the-media/2026-q2-theft-trends/
Checked 15 September 2026. Counts, value-sample limitation, categories and comparison cutoffs checked.
18. Florida Senate, 2026 Florida Statutes, § 812.014, Theft.
https://www.flsenate.gov/Laws/Statutes/2026/812.014
Checked 15 September 2026. Cited grading clauses and relevant exceptions checked; no sentencing terms reproduced.
19. Ronald G. Burns and Charles Crawford, “Moving Forward in the Study of Cargo Theft: Data Collection, Extent, and Crime Control Theater,” Journal of Applied Security Research, 2025.
https://www.tandfonline.com/doi/full/10.1080/19361610.2025.2472072
Checked 15 September 2026. Publisher abstract checked; full study not reviewed.
20. Verisk CargoNet, 2026 First Quarter Supply Chain Risk Trends Analysis, 23 April 2026.
https://www.cargonet.com/news-and-events/cargonet-in-the-media/2026-q1-theft-trends/
Checked 15 September 2026. Original quarterly counts, selected state and commodity counts and cutoffs checked.
21. Overhaul, United States & Canada Annual Cargo Theft Report 2025, public overview.
https://www.over-haul.com/reports/united-states-canada-annual-cargo-theft-report-2025
Checked 15 September 2026. Overview explicitly assigns 2,576 to the United States; detailed annual report not retrieved.
22. Florida Office of the Attorney General, six charged in alleged organized cargo-theft ring, 12 February 2026.
https://www.myfloridalegal.com/newsrelease/attorney-general-james-uthmeier-charges-six-organized-cargo-theft-ring-responsible-33
Checked 15 September 2026. Original announcement checked; figures remain dated allegations, not convictions.
23. Polk County Sheriff’s Office, cargo-theft investigation announcement, 29 November 2021.
https://www.polksheriff.org/news-investigations/2021/11/29/two-men-arrested-during-a-large-scale-organized-cargo-theft-investigation-5-businesses-defrauded-and-approximately-%24704-487-of-wooden-pallets-and-25-semi-trailers-stolen
Checked 15 September 2026. Original release checked; two empty trailers and different headline/body value descriptions retained.
24. Florida Department of Law Enforcement, Cargo Theft Crimes.
https://www.fdle.state.fl.us/cjab/ucr/individual-crime/others/cargo-theft
Checked 15 September 2026. Official dashboard page located; no filtered annual value independently extracted.
25. Donna Lemm, IMC Logistics, written testimony to the Senate Judiciary Committee, 15 July 2025; page 2, footnote 4.
https://www.judiciary.senate.gov/download/08/06/2025/2025-07-15_-testimony_-lemmpdf
Checked 15 September 2026. Original written testimony checked; it explicitly identifies NICB.
26. American Trucking Associations, “Trucking Industry Pushes Congress for Solutions to Skyrocketing Cargo Theft,” 15 July 2025.
https://www.trucking.org/news-insights/trucking-industry-pushes-congress-solutions-skyrocketing-cargo-theft
Checked 15 September 2026. Organization’s own statement checked through its indexed text; not an independently verified loss model.
27. Overhaul, “U.S. Cargo Theft Dipped in Q1 2026 While Deceptive Pickup Schemes Jumped 31%,” issuer-authored release, 18 May 2026.
https://www.prnewswire.com/news-releases/us-cargo-theft-dipped-in-q1-2026-while-deceptive-pickup-schemes-jumped-31-overhaul-report-finds-302773974.html
Checked 15 September 2026. Original release checked for U.S. count and stated state shares.
28. Verisk CargoNet, Q2 2025 Supply Chain Risk Trends Analysis, 17 July 2025.
https://www.cargonet.com/news-and-events/cargonet-in-the-media/2025-q2-theft-trends/
Checked 15 September 2026. Earlier snapshot checked; not substituted for a later comparator.
29. Overhaul, Q2 2025 United States Cargo Theft Report, public overview.
https://www.over-haul.com/reports/us-cargo-theft-report-q2-2025
Checked 15 September 2026. Original overview count checked; conflict with later annual comparison remains unresolved.
30. Verisk CargoNet, original 2025 year-end infographic, accompanying annual release.
https://www.cargonet.com/48f672/contentassets/c2d4126d197e4741872706de95dad634/cargonet_infographic_2025_yearend.png
Checked 15 September 2026. Original graphic visually checked: estimated loss $724,978,757.
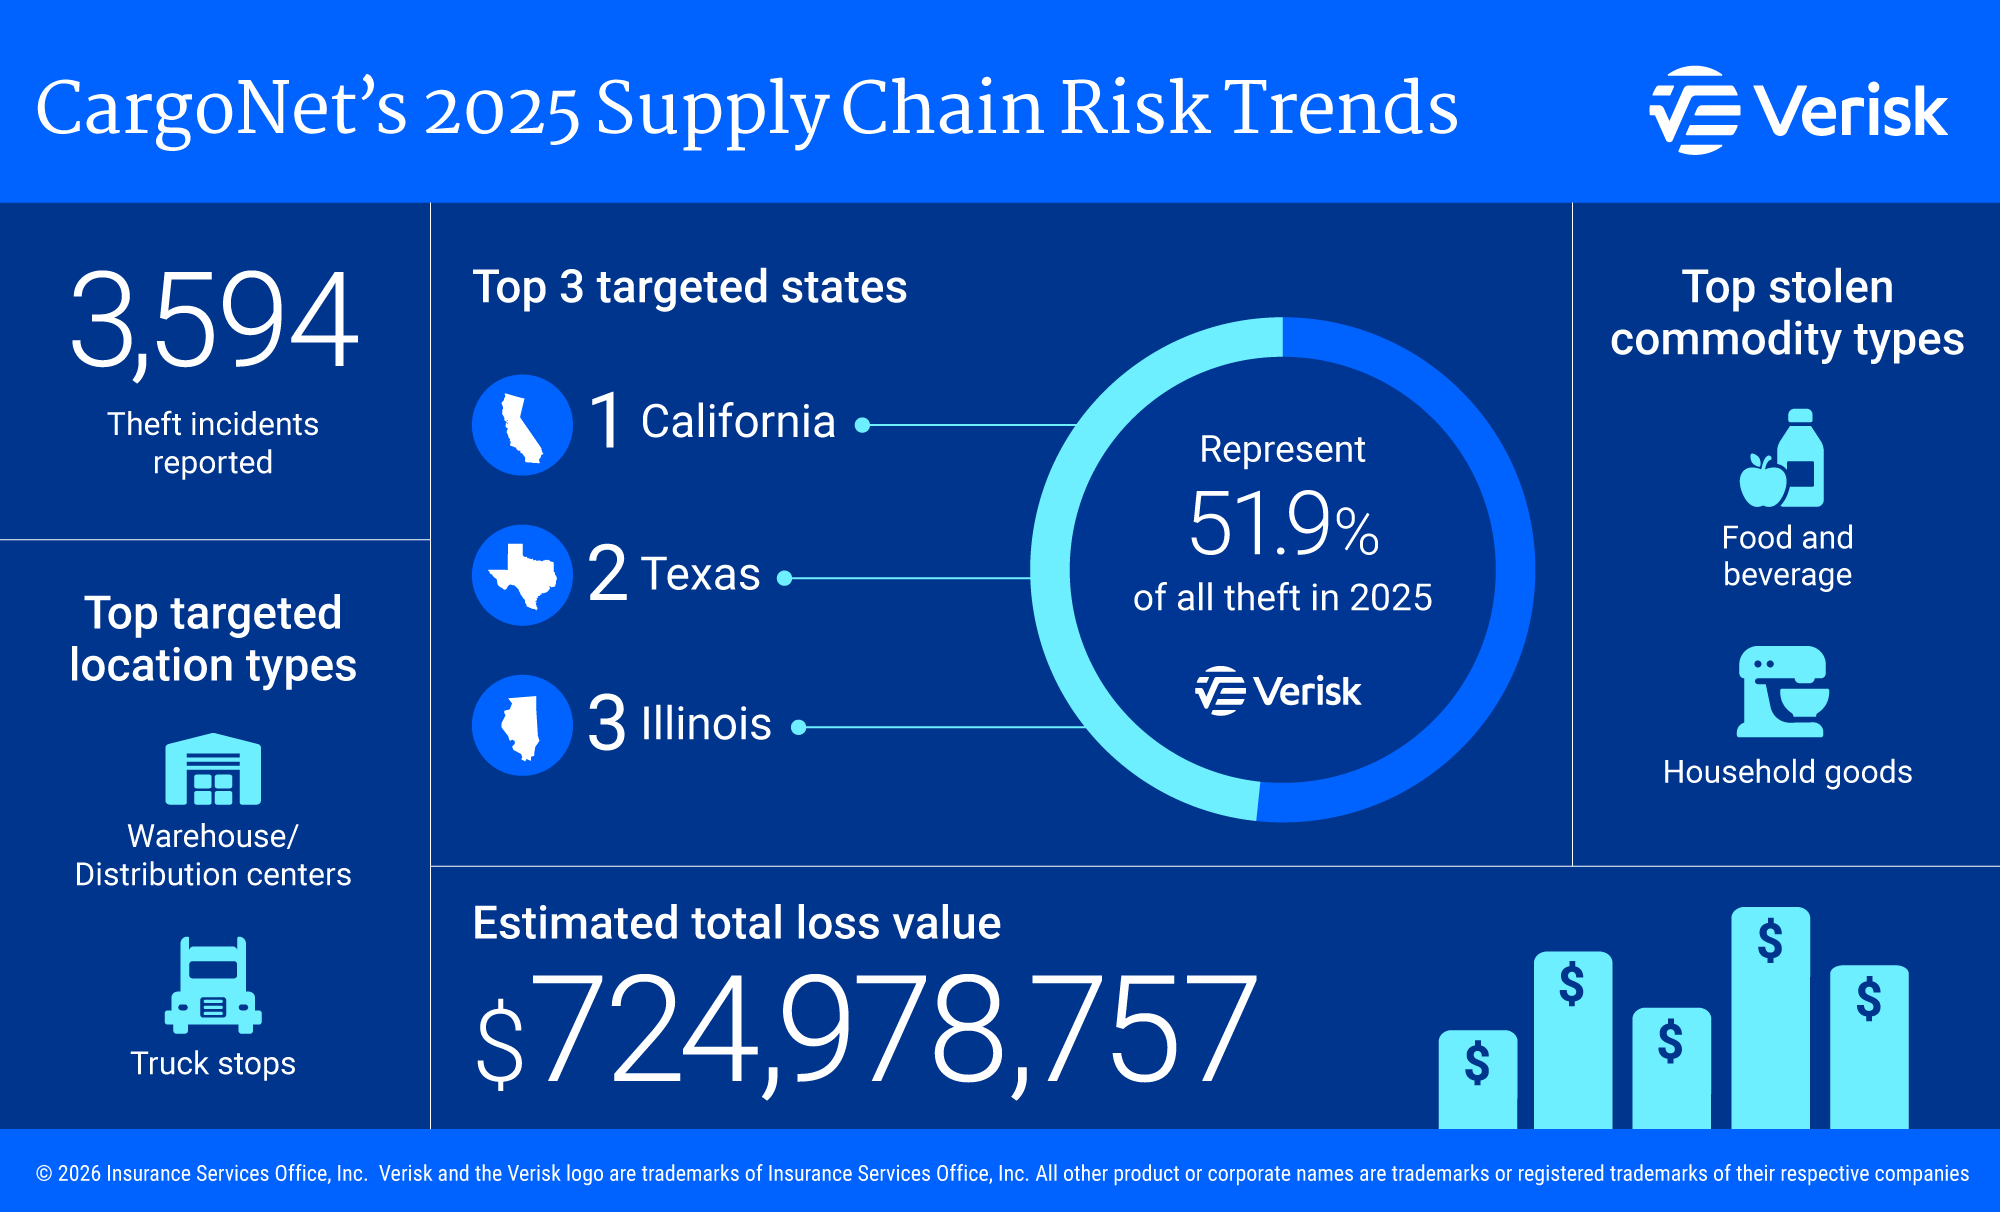
31. Verisk CargoNet, original 2024 year-end infographic, accompanying annual release.
https://www.cargonet.com/48ed21/siteassets/images/2024-cargo-theft-trends-infographic.png
Checked 15 September 2026. Original graphic visually checked: estimated loss $454,914,764.
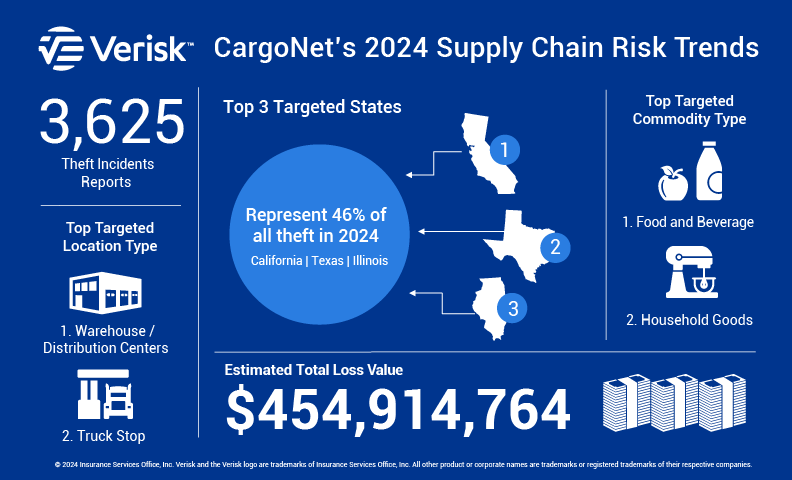
32. Public Law 109–177, USA PATRIOT Improvement and Reauthorization Act of 2005, enacted 9 March 2006; § 307(e), 120 Stat. 240.
https://www.congress.gov/109/plaws/publ177/PLAW-109publ177.pdf
Checked 15 September 2026. Original enacted law checked for cargo-reporting requirement and deadline.
33. Congress.gov, H.R. 2853, Combating Organized Retail Crime Act of 2025, reported text dated 30 January 2026, § 4.
https://www.congress.gov/bill/119th-congress/house-bill/2853/text/rh
Checked 15 September 2026. Dated committee-reported proposal checked; not presented as enacted law.
34. Association of American Railroads, “Railroads Applaud Bipartisan Legislation to Combat Supply Chain and Retail Theft,” 10 April 2025.
https://www.aar.org/news/railroads-applaud-bipartisan-legislation-to-combat-supply-chain-and-retail-theft/
Checked 15 September 2026. Original association statement checked; rail loss remains an attributed estimate.
35. U.S. Census Bureau, Commodity Flow Survey.
https://www.census.gov/programs-surveys/cfs.html
Checked 15 September 2026. Official freight-data program checked; no matched exposure denominator computed.
36. NICB, statement on Glawe’s Senate Judiciary testimony, 15 July 2025.
https://nicb.org/news/news-releases/nicb-president-and-ceo-david-j-glawe-testifies-us-senate-judiciary-committee
Checked 15 September 2026. Original organizational account checked; NICB has its own investigative case activity.
37. City of Lakeland, city news about Lakeland airport routes, March 2025; city and Polk County geographic description.
https://www.lakelandgov.net/news/posts/2025/march/city-news-blog-avelo-airlines-announces-two-new-routes-from-lakeland-grand-rapids-mich-and-long-island-ny-affordable-one-way-fares-from-lal-start-at-69-avelo-now-serves-nine-destinations-from-lal/
Checked 15 September 2026. Only the city’s Lakeland/Polk/I-4 geographic description is used.
Revision record
15 September 2026 — dataset version 1.2: checked the historical FBI tables and provider snapshots; retained source discrepancies rather than forcing agreement; corrected the territory label for Guam; separated the 2019 exclusion sensitivity from official totals; checked the 2026 Florida statutory clauses; linked the actual versioned data and reproducibility files.
This is the verification date for the present content, not an assertion about when the website first published it. Future revisions retain the source-vintage history rather than overwriting older snapshots without explanation.
Last verified: 15 September 2026
By Lakeland Dock Door Repair Research
Lakeland Dock Door Repair Research is the independent research and reference section of lakelanddockdoorrepair.com.